Your marketing campaign is always ‘work in progress’: KPI trackers to focus in 2021
A pillar feature enabled by an experienced DM of 20 years
Introduction
With the number of Key Performance Indicators (KPIs) increasing, it is tough for any digital marketer to choose which ones to track. Channel-specific choices are clear and concise for everyday monitoring. This makes each campaign a ‘work in progress’ to get results.
Every business relies on productivity, organic growth, financial structures and consumer behavior. A company may have to choose between integrated marketing campaigns which include various channels like Twitter, LinkedIn, YouTube videos, live events and/or virtual reality experiences. It will not be easy to have fixed indicators for revenue generation. The metrics require constant monitoring on live dashboards.
Each business requires diverse parameters for progress and continued success. However, there is no doubt that focus on client/customer is crucial to all businesses. Thus it is important to know about the top data-driven KPIs for a particular business.
This important feature discusses in detail the above table of contents. As a digital marketer of any enterprise, the information will prove useful.
Overview of top data-driven KPIs

Depending on the industry that you represent, relevant data should be measured. However, some are applicable to almost every enterprise which requires a strong online presence. To get all the resources for data gathering, keep three things in mind.
- Daily monitoring of data with zero or minimal human intervention.
- Using Google Analytics is a good way to start the process.
- Make a custom report and build the data with the audience insights.
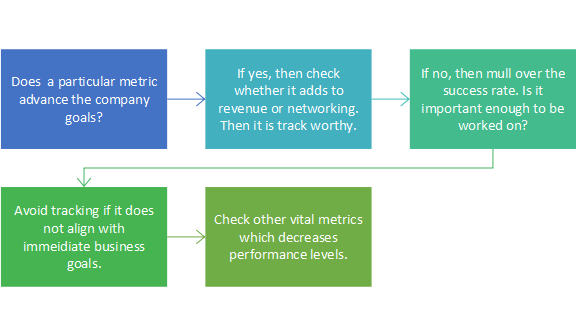
The right KPIs measure specific points and provide value to any campaign. Eliminate performance indicators that do not matter, but waste your time. As a marketer, you set up KPIs to measure areas which directly impact goals and revenue for the company. For example, a conversion is most critical part of a campaign. However, the ‘conversion’ has to be specific in order to become valued sales leads. If the operation is not focused on social media like FB and Twitter you can skip it to focus on other digital leads. Be clear about the metrics and KPIs that do not matter at this stage.
To explain this further:
- Skip those things/areas that cannot be changed even when results are clear.
- What does not impact the results, is certainly not worth tracking.
- Data that does not give information to improve revenue can be expelled.
- Avoid measuring metrics that only keep you alive in a search engine result.
- If ‘it’ does not convert into a sale, it should not matter at this point.
Ask yourself

Now that this aspect is clear, it is important to have clarity on KPIs and how different they are from metrics. Confusing the two will only add to complexity or failure of a campaign’s effort.
What is digital marketing KPI?
The KPIs are key performance indicators that matter to the output of digital marketing activities. Measuring them will help you to analyze the functions deployed for promotion. You can check if they are efficient and bringing meaningful results proportionately to the efforts being invested. They could be a blend on monitoring sales figures, best selling individual products or any other activity critical for business development. The scale of measurement will assist you in amplifying strategies and winning more customers. The same formula cannot apply to a restaurant that wants to increase the number of diners or takeaways and to a mid-sized enterprise that sells products online. Both want customers; but for each the KPI is different.
Keep in mind:
- KPIs are directly connected to the strategy being used.
- They could vary from SEO to sales growth to visibility of your brand.
- Data is derived from several online and offline sources.
- Choice of marketing automation tools being used.
Difference between KPIs and metrics
Short answer: Metrics comprise all those statistics and data that various analytics engines and dashboards throw at you. KPIs are those key insights you draw from a sensible analysis of relevant metrics. You define what the key indicators are for you, depending on the nature of your business and its current focus.
As a strategist, are you following a standard practice? Maybe you should segregate KPIs and metrics. It will reveal a few mistakes that you are making. However, both offer benchmarks to evaluate the direction you are heading towards.
A metric is generally accountable and tangible in nature. You can count it. For example, consider the ‘Leave a Message’ button. A customer can simply click and you know how many people have accomplished the function. It is a number game and very clear. As a high level marketer getting specific statistics or figures is good for decision making. It instantly gives a comparative insight and action can be taken. With accountable metrics it is easy to formulate goals and objectives. Each metric is evaluated and goals can be set to improve and perform better.
A KPI on the other hand is an indicator that can be digestible (but not figuratively). It provides information of past activity and can be used to deduce future possibilities. Different sets of activities can be organized and extracted as data. Once mined, there is no change in the insight that is already available.
Both KPIs and metrics depend on the following intel for execution of measurable targets like:
- Specific business goal and channel to convey the message.
- Factors relating to calculating goals.
- Frequently monitoring reports.
- Getting a grip on short term and long term values.
- Changing channels which do not work.
Core metrics and KPIs that every business requires

Cheat sheet to convince the management
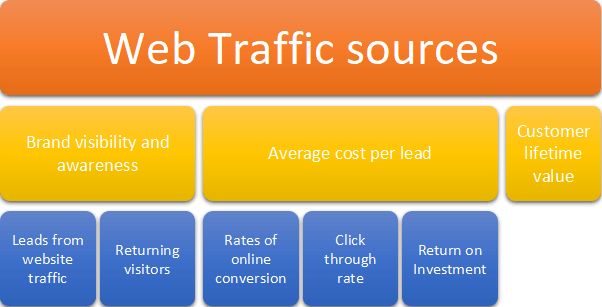
Although there are more than 40 popular KPIs, there are some that matter the most to non-native digital marketers. You will need to set specific goals and visualize the conversions. All gaps and questions are answered in this process. This exercise enables you to know if the website is effective and good for sales. Understand the key performance indicators with analysis from data available. For instance, as mentioned earlier they could relate to sales growth, SEO (search engine optimization), lead generations or brand awareness. As a secondary requirement, it can include data generated from online sales, web traffic details SERP (search engine rank page) and MQLs (marketing qualified leads). The same is revealed from social media ads from FB, LinkedIn and Google ads which impact web analytics. They provide clear overview of what is working for you and what isn’t making sense. Choosing the right KPIs is critical to explain budgets and expenditure.
Here is a cheat sheet that can help you to convince the management.
| Metric | Computing | Increase indications | Benchmarks |
| Customer Acquisition cost | It involves M & S costing, advertising, salaries and commissions for a specific period. | If you are spending more then it indicates that efficiency needs to be spruced up. Customers with a high LTV (life-time value) may be ignored as costs to acquire them increase. | What is the price point and which industry it is for? A benchmark can be set. |
| Marketing percentage of a customer acquisition | All marketing costs are divided by total expenditure of M & S for computation. | If costs are higher then the sales team may not have performed optimally. They could even get a lesser bonus for their efforts. It could also mean that the marketing team has not done their best. The deals are somewhat unbalanced. | The indicators could roughly be around 10-30% for outside sales. Inside sales indicators are about 20.50% Contactless sales 60-90% |
| Life Time Values (LTV) vis a vis Customer Acquisition | To calculate LTV, use annual payment from a customer and adjust with your margin. Divide by the annual churn or cancellation. It will give the ratio LTV divided by Customer acquisition. | If the LTV:CA ratio is higher, it indicates a increased ROI for M & S. | 1:1 is a good ratio3:1 Is better4:1 is the ideal business model |
| Time to payback | Divide the customer acquisition with the amount the customers pay you back every month. | If the payback is higher, then it takes longer for you to earn from the customer. This is not a good sign. | Less than 6 months, then it means under-investment 9-8 months is the ideal time lapse. Iif it exceeds 18 months, it could be a problem. |
| Customer % acquired through marketing | The % of new customers who sign up in a period with a marketing lead. | It will indicate if marketing is doing a better job or sales team is working harder at prospecting. | 20-40% outside sales 40-80% inside sales 70-95% contactless sales. |
| Customers influenced by marketing | Evaluate the new customers who interacted with marketing activities. | If more customers respond, then the marketing channels are effective. | 70% of marketing teams perform better. |
The success of your content could depend on other KPIs too. The increased traffic always indicates the success rate. It is only after the people come to you, that the engagement and conversions take place. Thus, your effort should be to increase the traffic. If you use Google analytics, there is a clear division between the users and sessions. This is important when you are blogging and tracking becomes a serious activity.
For further reading
Benefits of tracking KPIs and live dashboards
Since there are so many KPIs, it will be essential to set boundaries and dashboards for review. In the end, the bottom line profit (after cutting all costs) will be important. Set a limit for the time invested in the project/campaign. This KPI indicates if your efforts are being rewarded. A dashboard offers a panoramic view of the activities. It helps you to visualize the metrics and make changes if required for business growth. Real-time information will help the management to evaluate goals rather than just go by a gut feel. An ideal dashboard structure will focus on the following points.
- Monthly revenue of the company
- Net income
- Revenue growth
- Performance of the departments
- Quarterly goals for teams
- ROI on business deals
- Competitor analysis
Other than the CEO dashboard there are separate ones to measure KPIs for marketing and sales teams. If a project is underway it will have its own measurable dashboard analytics. When you create the dashboard, ponder about a few critical points.
- The purpose of a live dashboard. Which KPIs will be essential to add?
- Earmark the audience for which this exercise is meant.
- Which KPIs are actionable and worth tracking?
- Can charts be used? Which ones will be useful indicators?
- Adding benchmarks will secure the actual goals of the dashboard creation.
- Upgrade resources and KPIs for social media.
Here is a sound article to know more about KPI dashboard.
7 social media KPIs for 2021 for marketers to focus
Social media continues to play a huge role in engaging people. With the usage of smartphones the number of people on social media have also increased. Businesses have to dedicate a clear portion of their marketing activity that helps them reach customers via online channels. Earlier, brand awareness was the most important exercise; but now, segments are created to get specific audience. Currently, user generated content is great and good for business. As they create more communities, the content is relatable and comforting.
There is an entirely different set of KPIs that work for social media.
So, what will you need to focus on?
- Increase in followers for reach and engagement
- Likes and shares in an organic manner
- Creating impressions
- Ensuring mention of your brand in conversations
- Checking the bounce rate
- Monitoring conversion rate
- Equipping yourself with the social media tools to track KPIs
- Increase in voice and visual search
Today, the customers are keen on building a good relationship with the companies they deal with. Thus, right impact matters for marketing and sales teams. For instance, how do the new customers hear about your products in the crowded marketplace? It adds to the length of the sales cycle and customer journey. If you create an attribution model it could add value to your social metrics generation. It will help to connect the dots when a customer is interacting with your company or the brand. Create a marketing model that can measure multiple KPIs:
- Awareness
- Consideration
- Conversion
- Eventually, loyalty
- Spreading the news about the brand
There are plenty of software options that can help you to create attribution models and KPI dashboards to check live performances and one of them is the Wicked Reports.
Just to let you know: In 2021, live streaming and influencer content is trending for the last 2 weeks. If your brand is able to fit into the customer profile it is ideal for conversion.
Author Bio
Sreenivas Subramaniam has written blog posts on range of topics in digital marketing field. His blog posts have helped readers understand the topics better. He has worked with many internet marketing agencies in developing and promoting quality blog posts to many of the keen readers. Apart from blogging, his interests includes travelling, reading and photography.


Be First to Comment