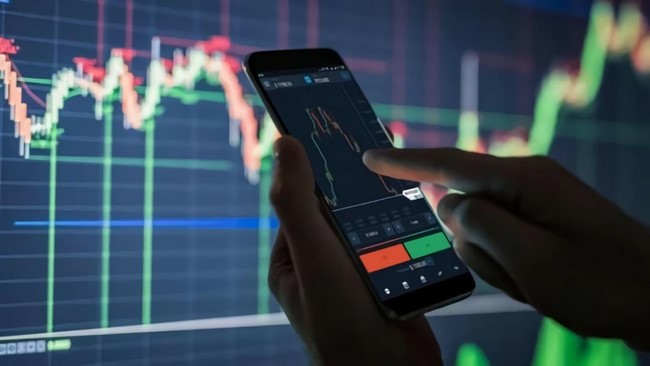
Whether you are an experienced trader or intriguingly stepping into the dynamic world of trading, understanding charts and patterns is vital. At the heart of these trading tools lies candlestick patterns, representing price movements and market sentiment. These patterns offer beneficial insights into potential reversals in the market, thus making it a key tool in forecasting the financial markets. Below, we will explore the complexities of candlestick charts and how they are used in trading. Keep reading to learn more.
Understanding the Anatomy of a Candlestick
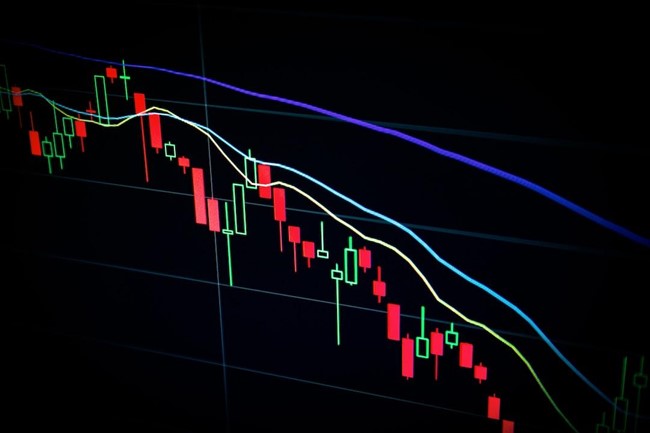
Each individual unit in a candlestick chart represents a specific time period. This could be anything from several minutes to a single day, week, or even month. This representation is commonly referred to as a candle. A candle comprises a body, displaying the opening and closing prices, and the wicks or shadows depicting the high and low prices within the defined period.
When the opening price is lower than the closing price within that time period, the candle body is usually colored or unfilled. This is termed a bullish candle. Conversely, if the closing price is lower than the opening price, the candle body is filled or shaded, representing a bearish candle. Understanding this critical interpretation is the first step toward mastering candlestick patterns.
Moreover, the length of the body and the wicks can provide more insights. Long bodies indicate strong buying or selling pressure, while short bodies signify little price movement and are often associated with consolidation. Long wicks, on the other hand, denote market indecision.
Decoding Single Candlestick Patterns
A single candlestick can impart a wealth of information. By studying various aspects of a candlestick, traders can garner insights into market sentiment. There are numerous types of single candlestick patterns, but we’ll focus on three basic and commonly seen patterns: hammer, hanging man, and doji.
The hammer and hanging man patterns closely resemble each other visually but signify different market sentiments. These patterns have small bodies, long lower wicks, and virtually no upper wicks. Hammer is seen as a bullish reversal pattern during a downtrend, and hanging man suggests a bearish reversal during an uptrend.
On the other hand, doji signifies market uncertainty and potential trend reversals, with the open and close prices being nearly equal, thus making the candle body very small, resembling a cross, inverted cross, or plus sign.
Revealing Double Candlestick Patterns
Even though single candlestick patterns can provide valuable information, candlestick chart analysis is typically more reliable when various candlestick patterns are combined to form a larger pattern. These larger patterns are called double candlestick patterns because they consist of two candlesticks. The commonly used double candlestick patterns are bullish and bearish engulfing and tweezers.
Bullish and bearish engulfing patterns indicate strong reversals. A bullish engulfing pattern consists of a small bearish candle, followed by a larger bullish candle, which ‘engulfs’ the real body of the bearish candle and is often seen as a sign of a potential bullish reversal. Similarly, the bearish engulfing pattern is the opposite and signals a possible bearish reversal.
On the other hand, tweezers consist of two candles, one bullish and one bearish, with either their tops or bottoms at the same level, suggesting a potential trend reversal. When combined with other technical analysis tools, these double candlestick patterns can greatly aid traders in predicting potential market movements.
Deciphering Complex Candlestick Patterns
Deeper than single and double candlestick patterns lies the complex candlestick patterns, often involving three or more candles. Bowing to the complicated nature, these patterns require a better understanding of candlestick patterns and more time to form. Patterns like morning star, evening star, three black crows, and three white soldiers fall under this category. Whether you’re a novice or an experienced trader, mastering the art of reading the candlestick pattern


Be First to Comment